Energy Profiles
plot_energy_profile draws reaction energy diagrams from simple Python data
structures. It can plot a single pathway, overlay related pathways, and show
side reactions.
from frust.vis import plot_energy_profile
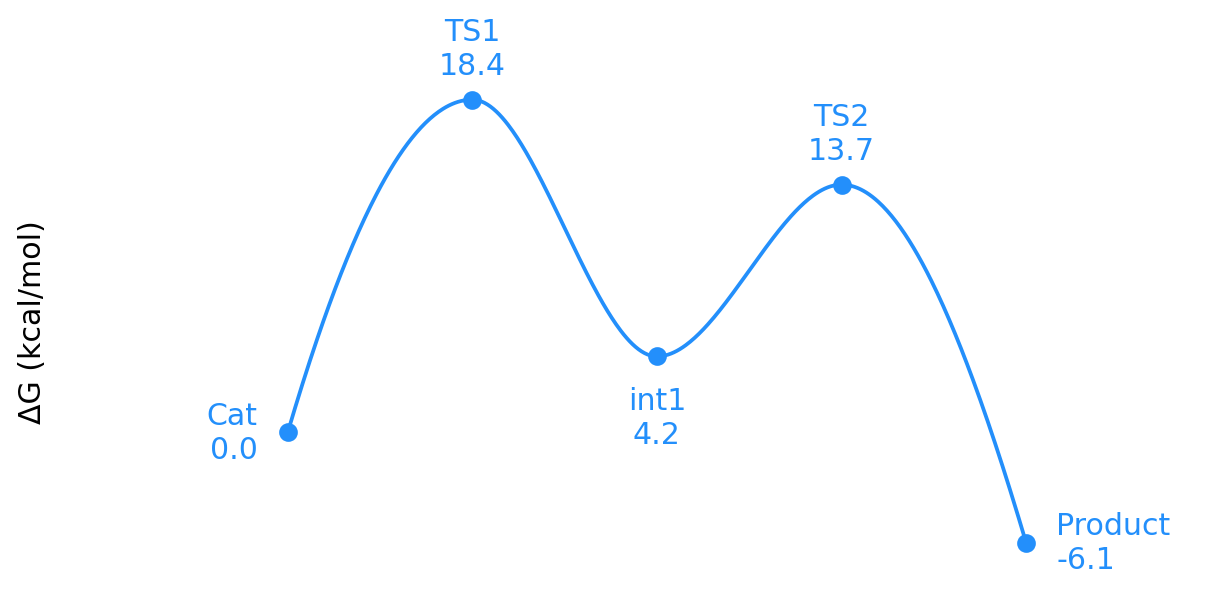
Minimal Profile
states = [
    ("Reactant", 0.0),
    ("TS1", 18.4),
    ("Intermediate", 4.2),
    ("TS2", 13.7),
    ("Product", -6.1),
]

fig, ax = plot_energy_profile(states)
Overlay Profiles
Use a dictionary when comparing pathways. The first entry is the reference profile used for x-axis layout.
profiles = {
    "Path A": [
        ("Reactant", 0.0),
        ("TS1", 18.4),
        ("Product", -6.1),
    ],
    "Path B": [
        ("Reactant", 0.0),
        ("TS1", 14.9),
        ("Product", -8.3),
    ],
}

fig, ax = plot_energy_profile(
    profiles,
    overlay_alpha=1.0,
    overlay_colors={"Path B": "tab:green"},
)
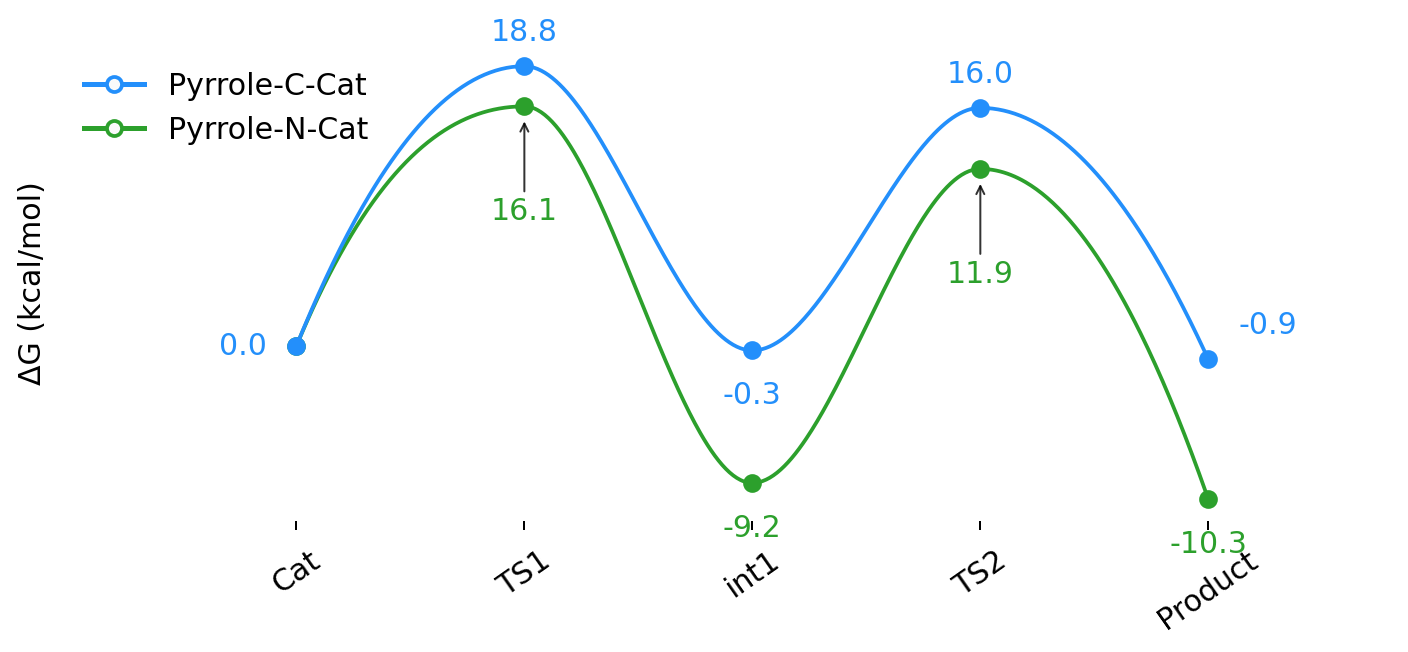
Recommended for overlays
Keep show_state_labels=True or leave it as the default for overlays. State
names then appear on the x-axis and point annotations stay compact.
Side Reactions
Add a side reaction by inserting a side-rxn marker before the side-path
states.
states = [
    ("Reactant", 0.0),
    ("TS1", 18.4),
    ("Intermediate", 4.2),
    "side-rxn@Intermediate@0.6#Side product",
    ("Side TS", 22.0),
    ("Product", -6.1),
    ("Side product", -3.0),
]

fig, ax = plot_energy_profile(states)
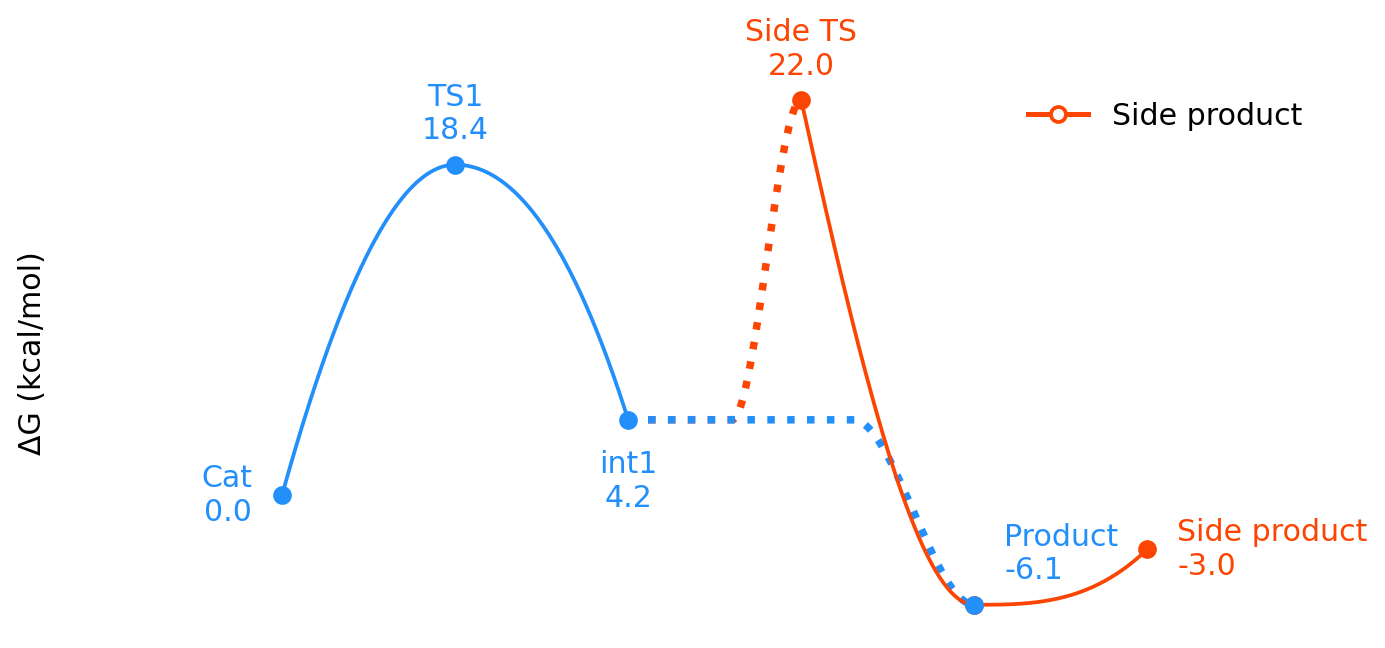
The marker format is:
side-rxn@anchor_label@rise_fraction#Legend label
anchor_labelis the state where the side connector begins.rise_fractioncontrols how much of the connector is flat before it bends.Legend labelis optional and appears in the legend.
Side-reaction ownership
Entries after side-rxn are treated as the side pathway, except for the
main product point that is pulled back into the main pathway. Label colors
follow the resolved pathway ownership, not just raw input order.
Label Placement
The optional third tuple item controls label placement:
("TS1", 18.4, "t")      # top
("int1", 4.2, "bb")     # farther below
("Product", -6.1, "tr") # top-right with arrow
Accepted short tokens are t, b, l, and r.
Rendering Pipeline
flowchart LR
    A["Input profiles"] --> B["Parsed states"]
    B --> C["Layout"]
    C --> D["Resolved styles"]
    D --> E["Matplotlib render plan"]
    E --> F["Figure and axes"]
Color one overlay
plot_energy_profile(
    profiles,
    overlay_colors={"Path B": ("tab:green", "tab:olive")},
)
A two-item color tuple sets (main_path_color, side_path_color).
The rendered output follows the same overlay style shown above, with the
second tuple color used for any side-reaction branch.