Molecular Grids
Use molecular grid helpers when you already have molecules, coordinate files, or reaction objects and want a quick notebook visualization.
Works without a FRUST workflow
MolTo3DGrid, RxnTo3DGrid, and DrawMolSvg are available from
frust.vis so notebooks can use one visualization import path.
3D Molecule Grids
MolTo3DGrid accepts RDKit molecules, SMILES strings, .xyz paths, or mixed
lists of those inputs. It renders an interactive py3Dmol grid.
from frust.vis import MolTo3DGrid

MolTo3DGrid(
    ["CCO", "CC(=O)O", "c1ccccc1"],
    legends=["ethanol", "acetic acid", "benzene"],
    highlightAtoms=[[1], [1, 2], [0, 1, 2, 3, 4, 5]],
    show_labels=True,
    show_charges=True,
    cell_size=(320, 320),
    columns=3,
    linked=True,
)
Interactive inspection
In the exported viewer, click atoms to toggle labels. Ctrl-click two atoms to measure a distance, and Shift-click three atoms to measure an angle.
Export a reusable HTML viewer
MolTo3DGrid(
    ["reactant.xyz", "transition_state.xyz", "product.xyz"],
    legends=["Reactant", "TS", "Product"],
    export_HTML="docs/assets/reaction-snapshot.html",
)
The exported file can be embedded with the same iframe pattern used above.
Common options include:
| Option | Use |
|---|---|
legends |
Add a label to each viewer cell |
highlightAtoms |
Highlight atoms in each molecule |
show_labels |
Draw atom labels before rendering |
show_charges |
Show formal charges as annotations |
show_confs |
Show all conformers instead of only one |
bonds_to_remove |
Hide selected bonds before rendering |
linked |
Rotate and zoom all cells together |
export_HTML |
Write the interactive viewer to an HTML file |
Reaction Grids
RxnTo3DGrid renders a reaction as reactants, an arrow cell, and products. It
accepts an RDKit reaction object or a reaction SMILES/SMARTS string.
from frust.vis import RxnTo3DGrid

RxnTo3DGrid(
    "CCO>>CC=O",
    legends=["ethanol", "acetaldehyde"],
    show_labels=True,
    show_charges=True,
    cell_size=(320, 320),
    linked=True,
)
Show mapped reaction changes
If the reaction is atom-mapped, RxnTo3DGrid can highlight changed bonds
and charges:
RxnTo3DGrid(
    mapped_reaction,
    show_bond_changes=True,
    show_charge_changes=True,
    check_reaction_stoichiometry=True,
)
Output is the same three-cell reaction viewer, with colored annotations for the mapped bond and charge changes.
Useful reaction options include:
| Option | Use |
|---|---|
show_bond_changes |
Highlight formed, broken, or changed-order bonds |
show_charge_changes |
Highlight atoms with changed formal charge |
h_mode |
Control hydrogen display around reactive atoms |
check_reaction_stoichiometry |
Warn when mapped atoms are not balanced |
linked |
Rotate and zoom the reaction cells together |
export_HTML |
Write the interactive reaction viewer to HTML |
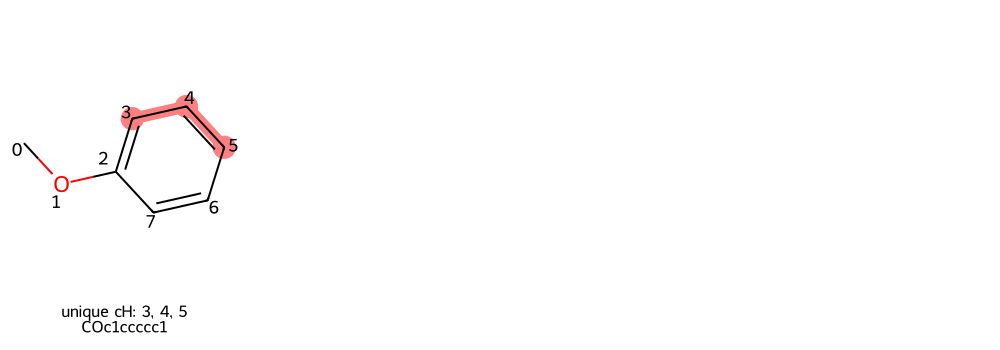
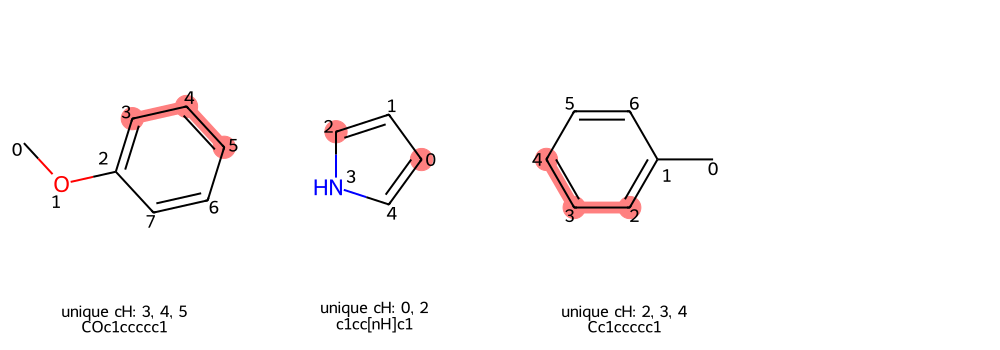
Unique Aromatic C-H Positions
DrawUniqueChGrid highlights symmetry-unique aromatic C-H positions. This is
useful before selecting reactive positions for substrate-scope runs.
Highlight unique positions from SMILES
from frust.vis import DrawUniqueChGrid

DrawUniqueChGrid("COc1ccccc1")
Highlight positions from a DataFrame
from frust.vis import DrawUniqueChGrid

DrawUniqueChGrid(df, smiles_col="smiles")
2D Molecule SVGs
DrawMolSvg is useful when a static 2D depiction is clearer than an
interactive 3D viewer. It can highlight atoms, draw atom indices, dim the rest
of the molecule, and return SVG for reports or notebooks.
from frust.vis import DrawMolSvg

DrawMolSvg(
    "COc1ccccc1",
    add_atom_indices=True,
    highlight_atom_indices=[4, 5, 6],
    highlight_as_circles=True,
)
